What Is a Bear Trap in Trading? Understanding the Risks and Strategies
Introduction to Trading and Market Trends
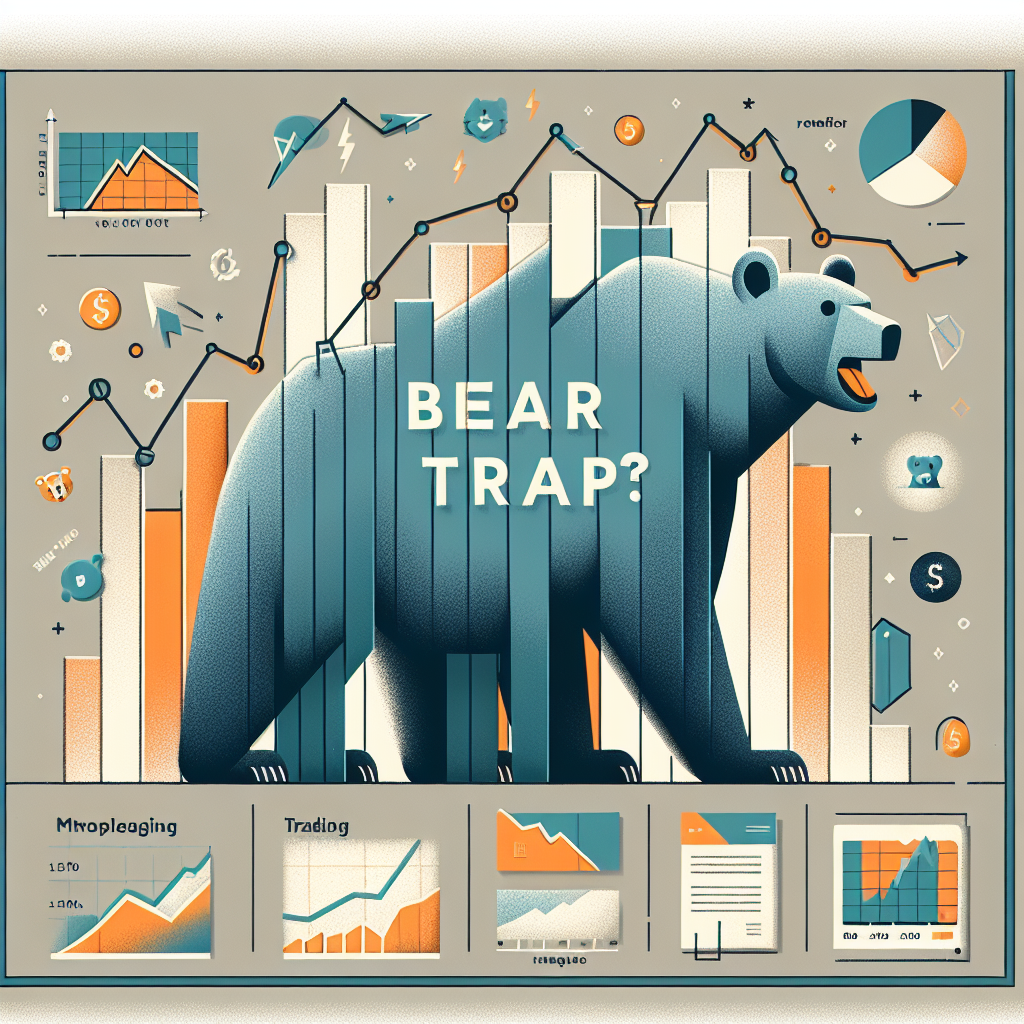
What Is a Bear Trap?
The Mechanics of a Bear Trap
Market Behavior Leading to a Bear Trap
Formation of a Bear Trap
Key Indicators and Technical Signals
Chart Patterns Associated with Bear Traps
- False Breakdowns: Prices temporarily fall below support levels, only to quickly rebound above them.
- Double Bottoms or Wickers: The presence of wicks or shadows below support levels indicates false moves.
- Volatility Spikes: Sudden increases in volatility often precede reversal movements.
Technical Indicators Supporting Bear Trap Detection
- RSI Divergence: When prices make new lows while RSI fails to follow suit, it signals a potential reversal.
- MACD Crossovers: A bullish crossover after a dip may indicate an upcoming rally.
- Support and Resistance Levels: Multiple tests of support that fail to hold can be deceptive, hinting at a false breakdown.
The Psychology Behind Bear Traps
Market Sentiment and Herd Behavior
Why Do Bear Traps Occur?
Implications for Traders
Risks of Falling Into a Bear Trap
Opportunities for Experienced Traders
Strategies to Avoid or Exploit Bear Traps
Confirmation Is Key
Use of Multiple Indicators
Incorporate Risk Management
Exploiting Bear Traps
Examples of Bear Traps in Market History
- Bitcoin 2018: During the cryptocurrency boom, Bitcoin experienced multiple false breakdowns below critical support levels, only to reverse sharply and trap short-sellers.
- Stock Market Corrections: During the 2008 financial crisis, some stocks showed false breakdowns that led to quick rebounds, enriching savvy traders.
Conclusion: Navigating the Minefield of Bear Traps
Additional Resources for Traders
- Investopedia – Bear Trap
- ChartPatterns.com – Bear Traps
- TradingView Charting Platform
- BabyPips – Forex Trading Education